
Product Sales Profit
Product Sales Profit is the report that tells you which products actually earn. For each item it puts revenue next to cost, so a bestseller that makes nothing and a quiet line that carries the business both become visible.
Menu path: Sales > Reports > Product Sales Profit
URL: https://my.ososs.com/dashboard/reports/product-sales-profit
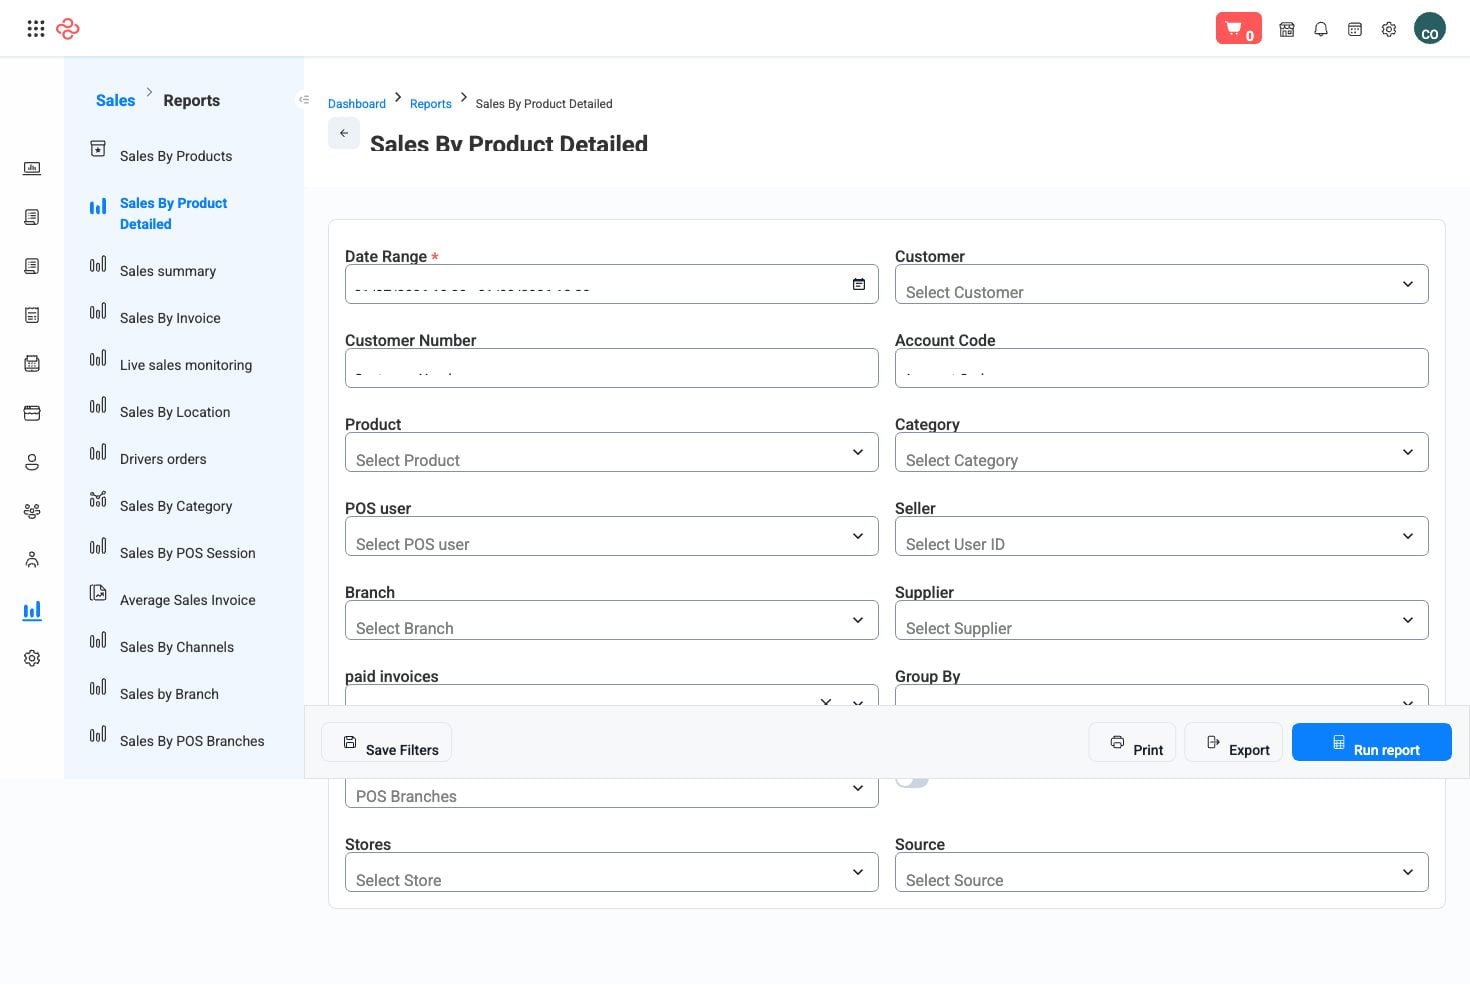
How the profit is calculated
For every product sold in the period the report takes what you charged and subtracts what the goods cost you:
| Element | Where it comes from |
|---|---|
| Quantity sold | Invoice lines in the period |
| Revenue | Line value after discounts |
| Cost | The cost recorded against the stock that was sold |
| Profit | Revenue less cost |
| Margin | Profit as a share of revenue |
The cost figure is the one to understand. It comes from what you actually paid for the units sold, which means every purchasing habit shows up here: freight and customs entered on the bill make the cost real, and the same costs left in an expense account make every margin on this report too high.
Returns and refunds reduce both sides, so a heavily returned product shows its true contribution rather than its gross sales.
Reading it
- Sort by profit, not by revenue. The two orders are rarely the same, and the difference is the whole point of the report.
- Then sort by margin. High-revenue low-margin lines are volume you are working hard for; high-margin low-volume lines are usually worth promoting.
- Look for negatives. A product sold below cost is either a pricing error, a discount stack, or a cost correction that landed after the sale - all fixable once seen.
- Read it monthly and act on the extremes. The top ten and the bottom ten are the only rows most businesses need to do something about.
Related pages
- Profit and Loss - the same question at company level
- Sales by Products - volume and value without the cost side
- Purchase Cost Adjustments - correcting the cost this report uses